
Free & Open-Source Model Monitoring: A Practical Guide to Evidently AI with Prometheus & Grafana
I. Introduction: Why Model Monitoring is Critical for ML in Production 🛡️
In the rapidly evolving landscape of machine learning in production, one of the most overlooked yet business-critical components is model monitoring. Many startups and even mature tech teams focus heavily on training accurate models but neglect the reality that, once deployed, these models face changing environments and data distributions. Without proper monitoring, unseen data drift or concept drift can silently degrade model performance, leading to lost revenue, compliance risks, and reduced user trust.
📉 The Problem: Imagine launching a fraud detection model trained on historical transaction data. Six months later, the nature of fraudulent behavior has shifted — your model is now making poor predictions. Still, without a monitoring system in place, no one notices until customers start complaining. This is why proactive monitoring isn’t optional; it’s a safeguard against costly performance degradation.
🔗 Role in the MLOps Lifecycle: Model monitoring acts as the critical bridge between deployment and retraining in the MLOps loop. By continuously tracking performance metrics and data integrity, teams can automate triggers for retraining pipelines, prevent dire predictions from reaching production, and maintain compliance with industry standards. For a deeper view of this lifecycle, refer to our Ultimate Guide to Cost-Effective Open-Source MLOps in 2025, which outlines how monitoring integrates seamlessly with experiment tracking, orchestration, and deployment.
📜 Best Practices from Industry Leaders: According to Google Cloud’s MLOps guidelines, robust model monitoring should include:
- Tracking both input data quality and output prediction accuracy
- Setting custom drift thresholds to trigger alerts
- Automating model retraining workflows based on monitoring signals
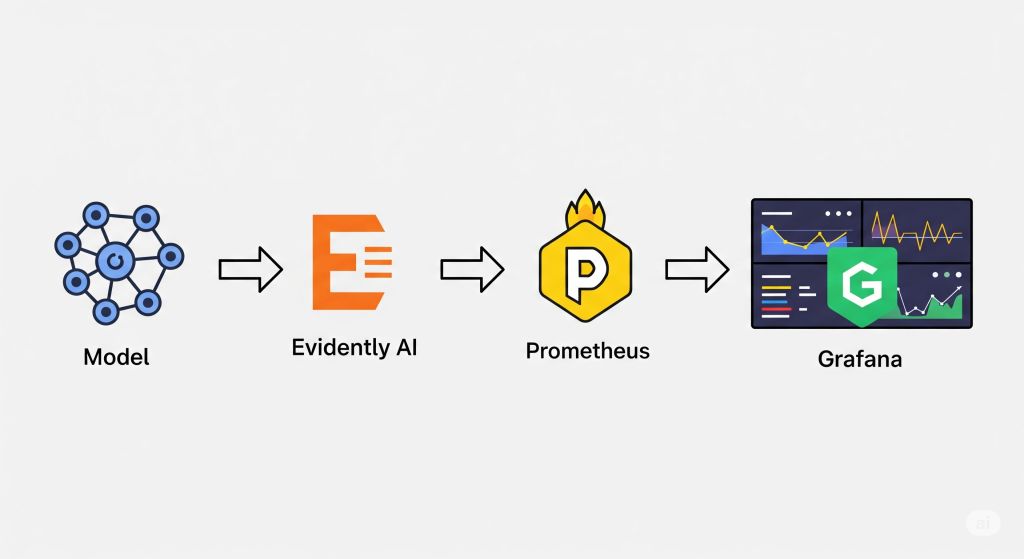
💡 Pro Recommendation: To get started without incurring heavy infrastructure costs, consider Evidently AI for drift detection and reporting, paired with Prometheus for metrics collection and Grafana for real-time visualization. This open-source trio offers a cost-effective yet powerful way to ensure your models stay healthy in production.
II. Understanding Model Drift & Performance Degradation 📉
In production ML systems, your model’s performance is rarely static. Over time, the data it encounters changes — sometimes subtly, sometimes drastically — leading to model drift. If left unaddressed, this drift leads to performance degradation, which can negatively impact both business outcomes and user trust. Let’s break it down into two major types: data drift and concept drift.
📊 Data Drift: Changes in Input Distribution
Data drift happens when the statistical distribution of input features changes compared to what the model saw during training. For example, imagine a computer vision model trained to detect products in an e-commerce setting. Suppose the lighting, backgrounds, or image resolution in new product photos change significantly (perhaps due to a change in photography equipment). In that case, the model might struggle even though the underlying prediction task remains unchanged.
Open-source tools like Evidently AI can automatically calculate drift metrics (e.g., the KS test, PSI) and generate visual reports, enabling you to catch issues early. This is especially useful for startups that need to monitor data quality without having to build a custom monitoring framework from scratch.
🔄 Concept Drift: Changes in Input–Output Relationship
Concept drift occurs when the relationship between input features and the target variable changes. Unlike data drift, here the problem isn’t that the inputs are different — it’s that the meaning of those inputs changes over time. For example, a fraud detection model might still receive the same transaction features, but new fraud patterns emerge that make past correlations less predictive.
Kubernetes-based monitoring stacks, utilizing Prometheus and Grafana, can track not only data distributions but also real-world performance metrics (e.g., accuracy, recall) to detect concept drift in near real-time.
🖼️ Visual Insight: From Training → Deployment → Drift Over Time
A helpful way to visualize this is a timeline chart:
- Training phase: The model is aligned with the data.
- Early deployment: Predictions match expectations.
- Drift onset: Data and/or target relationships shift gradually.
- Degraded performance: Model accuracy and reliability drop unless retraining occurs.
🎤 Voice Search Optimization – FAQ
Q: What is the difference between data drift and concept drift in machine learning?
A: Data drift is when the distribution of your input features changes, while concept drift is when the relationship between your inputs and the target output changes. Both can harm model performance, but they require different monitoring and retraining strategies.
💡 Pro Recommendation: If you’re just starting, I recommend combining Evidently AI for drift detection with Grafana dashboards for visualization — a cost-effective and production-proven stack for keeping your ML models healthy.
III. Tool #1: Evidently AI 🧪
Evidently AI is an open-source Python library explicitly designed for model monitoring and drift detection in production ML systems. It offers a practical and cost-effective way for startups to ensure their models remain accurate and reliable without committing to expensive, proprietary monitoring solutions. By integrating Evidently AI into your workflow, you can automate checks for data drift, concept drift, and even model performance degradation.
🔑 Key Features: Pre-Built Reports, Dashboards, and API Integration
Evidently AI comes packed with pre-built templates for drift analysis, data quality checks, and performance metrics. You can generate interactive HTML dashboards or JSON reports that can be plugged into CI/CD pipelines, making it easy to automate model health checks.
Another standout feature is its API integration, which allows you to embed drift detection into an existing monitoring stack, such as Prometheus and Grafana. This means your data science team and your DevOps engineers can work from the same real-time metrics view.
📚 Authoritative Source: According to the Evidently AI documentation, their tool supports over 50 metrics for drift detection, including PSI (Population Stability Index), KS-test, and Jensen–Shannon divergence, making it versatile for different domains.
✅ Pros & ❌ Cons for Startups
Pros:
- Free and open-source — no licensing fees.
- Simple Pythonic API for easy integration.
- Works well with Jupyter notebooks for ad-hoc analysis.
- Compatible with popular MLOps tools like MLflow and Airflow.
Cons:
- No built-in alerting — requires integration with external systems, such as Prometheus, for notifications.
- More focused on batch monitoring than real-time streaming use cases.
🐍 Example: Minimal Python Snippet for Drift Detection
import pandas as pd
from evidently.report import Report
from evidently.metric_preset import DataDriftPreset
# Load reference (training) and current (production) datasets
ref_data = pd.read_csv(“reference_data.csv”)
curr_data = pd.read_csv(“current_data.csv”)
# Create and run drift report
report = Report(metrics=[DataDriftPreset()])
report.run(reference_data=ref_data, current_data=curr_data)
# Save report as HTML
report.save_html(“drift_report.html”)
With just a few lines of code, you can generate a fully interactive drift report to share with stakeholders.
🎯 Upgrade Your Monitoring Skills
If you’re ready to take your monitoring game to the next level, I recommend Advanced Model Monitoring on Coursera. This course delves into in-depth production ML monitoring strategies, including drift detection, alerting pipelines, and automated retraining triggers — the perfect complement to an Evidently AI setup.
IV. Tool #2: Prometheus 📊
Prometheus is an open-source time-series database designed for collecting, storing, and querying metrics from applications and infrastructure. In the context of machine learning monitoring, it plays a crucial role as the metrics backend — capturing everything from API latency to model accuracy over time. This enables teams to set up real-time alerting and perform historical performance analysis on their deployed models.
📚 Authoritative Source: The official Prometheus documentation highlights that its pull-based data collection model and PromQL query language make it a standard choice for observability in cloud-native environments.
🔗 How Prometheus Complements Evidently AI
While Evidently AI focuses on detecting data drift and performance degradation, Prometheus handles the operational side of monitoring. This means you can:
- Scrape and store metrics like model latency, request count, and prediction error rates.
- Trigger alerts when thresholds are breached (e.g., latency spikes or accuracy drops).
- Integrate with Grafana to visualize metrics alongside Evidently AI drift reports.
A typical setup would have Evidently AI generating drift metrics and exposing them via an HTTP endpoint, which Prometheus scrapes at regular intervals for storage and alerting.
🖥 Example: Prometheus Scraping Model Latency & Accuracy Metrics
Let’s say you deploy a model API and expose the following metrics:
# HELP model_latency_seconds Time taken for model predictions
# TYPE model_latency_seconds gauge
model_latency_seconds 0.35
# HELP model_accuracy Current rolling accuracy of predictions
# TYPE model_accuracy gauge
model_accuracy 0.92
A Prometheus scrape configuration in prometheus.yml might look like this:
scrape_configs:
– job_name: ‘ml_model’
static_configs:
– targets: [‘model-service:8000’]
This setup ensures your latency and accuracy are tracked in real-time — essential for alerting and SLA compliance.
🎯 Recommendation for Startups
If you’re new to observability and want a quick start with Prometheus, I recommend using Grafana Cloud Free Tier, which includes hosted Prometheus and Grafana. This removes the overhead of self-hosting, allowing you to focus on instrumenting your ML services.
For teams ready to delve deeper into monitoring and alerting best practices, I highly recommend the Google Cloud SRE Specialization on Coursera, which covers production-grade observability stacks, including Prometheus.
V. Tool #3: Grafana 📈
Grafana is an open-source analytics and visualization platform that acts as the perfect frontend layer for metrics collected by Prometheus. In the context of model monitoring, Grafana transforms raw metrics into actionable insights by displaying them in real-time dashboards and enabling custom alerting rules.
📚 Authoritative Source: The official Grafana documentation details its capabilities for integrating with various data sources, including Prometheus, Elasticsearch, and Loki, making it a versatile choice for MLOps monitoring stacks.
🔍 Creating Real-Time Dashboards for Model Monitoring
By connecting Grafana to Prometheus, you can visualize key machine learning KPIs such as:
- Model latency (milliseconds per prediction) ⏱️
- Prediction accuracy trends 📊
- Request volume over time 📈
- Data drift metrics from Evidently AI 🔄
A typical workflow involves creating a Prometheus data source in Grafana, then building panels to display metrics with color-coded thresholds for quick anomaly detection. This is especially useful for 24/7 production environments where downtime or performance degradation directly impacts revenue.
🖥 Example: Grafana Dashboard Panel for Drift Alerts
Imagine a line chart panel that plots Evidently AI’s data drift score over time. If the drift exceeds 0.3 (a threshold you define), the panel changes to red, and Grafana triggers an alert to your Slack or Microsoft Teams channel.
PromQL Query Example:
avg_over_time(data_drift_score[1h])
This type of visualization not only allows for quick decision-making but also serves as a historical record for root cause analysis when model performance issues arise.
🎯 Recommendation for Startups & Teams
If you’re starting small, I recommend Grafana Cloud Free Tier, which includes hosted Grafana and Prometheus with zero setup hassle. This is ideal for lean teams that want enterprise-grade monitoring without heavy infrastructure costs.
For those looking to master advanced dashboarding, I highly recommend “Data Visualization with Grafana” on Udemy, which covers building ML-specific monitoring panels and alerting pipelines.
VI. Step-by-Step: Building a Free Model Monitoring Stack ⚡
In this section, we’ll build a completely free, open-source monitoring stack combining Evidently AI 🧪, Prometheus 📊, and Grafana 📈. This setup enables startups to detect data drift, monitor performance metrics, and receive alerts—without the expensive overhead of enterprise SaaS monitoring tools.
📚 Authoritative Source: This workflow follows the best practices in Google Cloud’s MLOps guidelines for continuous monitoring and retraining.
⚙️ Step 1: Install Evidently AI, Prometheus, and Grafana
You can install everything locally with the following commands:
# Install Evidently AI
pip install evidently
# Install Prometheus & Grafana via Docker
docker network create monitoring
docker run -d –name=prometheus –network=monitoring -p 9090:9090 prom/prometheus
docker run -d –name=grafana –network=monitoring -p 3000:3000 grafana/grafana
💡 Recommendation: For lean teams, I recommend starting with Grafana Cloud Free Tier to avoid maintaining infrastructure yourself.
📄 Step 2: Set up Evidently AI Reports
Evidently AI can generate data drift and model performance reports in HTML or JSON formats. Here’s a minimal example:
from evidently.report import Report
from evidently.metrics import DataDriftPreset
import pandas as pd
ref_data = pd.read_csv(“train.csv”)
cur_data = pd.read_csv(“production.csv”)
report = Report(metrics=[DataDriftPreset()])
report.run(reference_data=ref_data, current_data=cur_data)
report.save_html(“drift_report.html”)
These metrics can be exported to Prometheus format for time-series storage.
⏱ Step 3: Configure Prometheus to Scrape Metrics
Create a prometheus.yml configuration file:
global:
scrape_interval: 15s
scrape_configs:
– job_name: ‘evidently’
static_configs:
– targets: [‘localhost:8000’]
This instructs Prometheus to retrieve metrics (such as drift scores and accuracy rates) from your Evidently service endpoint.
📊 Step 4: Create Grafana Dashboards
Once Prometheus is connected, open Grafana → Add Data Source → select Prometheus.
Then, create panels to display:
- Model accuracy trends ✅
- Latency changes ⏱
- Data drift over time 🔄
You can use PromQL queries like:
avg_over_time(model_accuracy[1h])
🚨 Step 5: Set Alerts for Drift & Performance Drop
In Grafana, set up alert rules so your team is notified on Slack, Teams, or email when:
- Data drift score > 0.3
- Model accuracy drops below 85%
This ensures proactive retraining before the model causes real-world issues.
💡 Skill Upgrade Tip: If you want to master alert-driven monitoring, I recommend Site Reliability Engineering: Measuring and Managing Reliability – Coursera, which covers incident response best practices relevant to MLOps.
VII. Integration with the MLOps Pipeline 🔗
Model monitoring is not an isolated task—it’s the connective tissue that keeps your entire MLOps pipeline healthy and cost-effective. Without it, even the best-trained models deployed with cutting-edge tools can quietly degrade, leading to inaccurate predictions, lost revenue, and reputational damage.
📚 Insight: According to Google Cloud’s MLOps best practices, continuous monitoring should feed directly into retraining pipelines, ensuring that data drift and performance issues are caught before they impact business-critical systems.
🔬 Connecting with Experiment Tracking
Monitoring outputs—such as accuracy drops or data drift scores—should feed back into experiment tracking systems, including MLflow, Weights & Biases, or Neptune.ai.
- Why: This creates a closed feedback loop, where new experiments are triggered only when metrics cross specific thresholds, thereby saving compute costs.
- Recommendation: Set up tagging in your experiment tracker so you can link retraining jobs directly to drift alerts.
📎 Related cluster guide: Lean Experiment Tracking: MLflow vs. W&B vs. Neptune
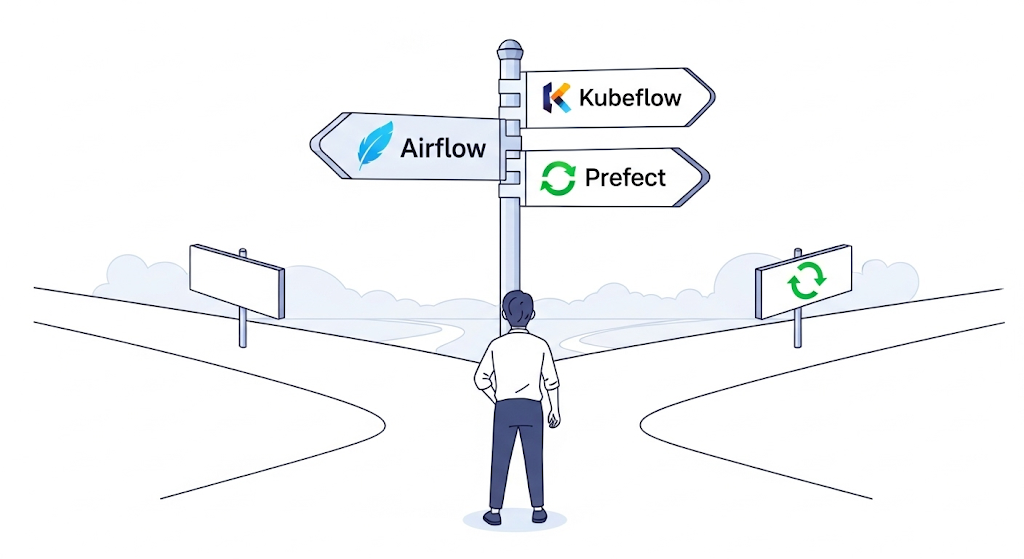
⚙️ Linking with Workflow Orchestration
Tools like Prefect or Apache Airflow can schedule retraining jobs based on monitoring alerts. For example, if Grafana detects concept drift, Prefect can automatically trigger a pipeline that pulls new data, retrains the model, and redeploy it.
- Benefit: Eliminates manual intervention, reducing MTTR (Mean Time to Recovery) for underperforming models.
📎 Related pillar section: Workflow Orchestration in the Ultimate Guide to Cost-Effective Open-Source MLOps in 2025
🚀 Integration with Model Serving
Monitoring must also integrate with your serving layer—whether you deploy via Seldon Core or BentoML.
- Example: Seldon Core can emit live performance metrics directly to Prometheus, allowing Grafana to visualize latency spikes and accuracy drops.
- Recommendation: For teams already running Kubernetes, I recommend pairing Seldon Core with Prometheus for enterprise-grade scalability.
📎 Related guide: Deploying Models: Seldon Core vs. BentoML
💡 Pro Tip: If you want to master end-to-end monitoring-triggered retraining pipelines, consider the Coursera course “Advanced Model Monitoring,” which delves deeply into real-world integration patterns across tracking, orchestration, and serving.
VIII. Cost Considerations 💰
When planning a model monitoring stack with Evidently AI, Prometheus, and Grafana, cost is a critical factor—especially for startups and lean teams. While the tools themselves are free and open source, the infrastructure and operational expenses can vary significantly depending on your deployment strategy.
🏠 On-Prem vs ☁️ Cloud Deployment
- On-Premise: Running Prometheus and Grafana on your servers can minimize direct cloud costs but increases the need for skilled DevOps engineers to handle maintenance, scaling, and backups. This path is viable if you already have idle server capacity.
- Cloud-Hosted: Managed services, such as Grafana Cloud or Amazon Managed Service for Prometheus, reduce operational overhead but come with recurring subscription or usage-based fees.
- I recommend Grafana Cloud’s free tier for early-stage projects—it includes 50 GB of logs and a 14-day retention period, which is sufficient for initial monitoring setups.
📚 Reference: The CNCF Cloud Native Landscape provides a complete breakdown of monitoring and observability solutions, their hosting options, and ecosystem compatibility.
💡 Hidden Costs You Should Plan For
- Engineering Time: Setting up and tuning Prometheus scraping, Grafana dashboards, and Evidently AI reports requires skilled engineers. For non-Kubernetes setups, additional integration work is needed.
- Alert Fatigue: Poorly configured alerts can overwhelm your team, leading to ignored warnings and missed incidents. Invest time in optimizing alert thresholds to minimize noise.
- Scaling Costs: As your monitored model portfolio grows, storage and compute requirements for Prometheus will increase.
📦 Cost-Saving Recommendations
- Use Grafana provisioning scripts to standardize dashboards and reduce manual setup.
- Archive old metrics to cheaper storage (e.g., AWS S3) to cut Prometheus retention costs.
- Consider pairing your monitoring stack with Prefect Cloud to automate retention policies and trigger only relevant jobs.
IX. Advanced Features & Scaling 📡
Once you’ve set up a basic Evidently AI + Prometheus + Grafana stack, the next step is to explore advanced features that allow you to handle multi-model environments, improve detection accuracy, and scale for production-grade workloads. These enhancements ensure that your monitoring pipeline grows in tandem with your machine learning operations.
🧩 Multi-Model Monitoring with One Stack
A common scaling challenge is tracking multiple models—each with unique metrics, drift patterns, and retraining schedules. With Prometheus label configurations and Grafana variable templates, you can manage model-specific dashboards without needing to duplicate configurations.
- Example: Assign model_name labels in Prometheus scrapes, then filter in Grafana by dropdown.
- I recommend using Grafana’s Dashboard Templating to streamline this process for large teams.
🚨 Adding Anomaly Detection to Drift Alerts
While Evidently AI already supports drift metrics, integrating anomaly detection algorithms can minimize false positives. You can:
- Export drift scores to Prometheus.
- Use Grafana’s Alerting with Threshold + Percentile rules to detect unusual deviations.
- Integrate with tools like Apache Superset for richer historical analysis.
For an enterprise-grade solution, I recommend AWS Lookout for Metrics, which uses ML for anomaly detection at scale.
☸️ Kubernetes Deployment Patterns
If you’re running Kubernetes in production, you can deploy the complete monitoring stack as separate namespaces:
- Evidently AI: Deployed as a Python service with REST endpoints for drift analysis.
- Prometheus Operator: Automates metric scraping and alert configuration.
- Grafana Helm Chart: Installs dashboards with persistence for long-term monitoring.
📚 Reference: The Prometheus Operator GitHub outlines how to manage Prometheus in Kubernetes with minimal manual YAML editing.
I recommend the “Architecting with Kubernetes” Coursera course for teams looking to productionize ML monitoring with cloud-native best practices.
X. Best Practices for Effective Model Monitoring ✅
Building a model monitoring pipeline is only half the battle—making it effective requires applying best practices that ensure accuracy, stability, and long-term scalability. Below are three essential strategies I recommend to any team deploying ML models in production.
🎯 Choose the Right Drift Thresholds
Setting drift detection thresholds too low can lead to alert fatigue, while setting them too high might miss critical issues. The optimal threshold often depends on your business context:
- For financial fraud detection, I recommend stricter thresholds (e.g., KL divergence < 0.05).
- For recommendation systems, a slightly higher tolerance can reduce noise.
📚 Reference: Google Cloud’s MLOps Guidelines provides industry-backed best practices on tuning thresholds for drift and accuracy.
🔄 Automate Retraining Triggers
One of the most potent uses of monitoring is closing the loop by automatically retraining models when performance drops. This can be done by:
- Using Prometheus alert hooks to trigger a retraining job in your CI/CD pipeline.
- Leveraging Kubeflow Pipelines or Prefect to orchestrate retraining workflows.
I recommend the Practical MLOps – Coursera course to learn automation patterns for ML retraining pipelines.
🛠 Include Monitoring in CI/CD Workflows
Monitoring should not be an afterthought—it should be integrated into your ML CI/CD so every deployment includes metrics tracking from day one.
- Example: Deploying a new model version with Seldon Core while pre-registering its Prometheus scrape configs.
- Benefit: Avoids “dark launches” where a model runs in production without visibility.
📖 Reference: The CNCF Cloud Native Landscape lists ecosystem tools that can embed monitoring in continuous delivery pipelines.
XI. FAQ 🔍
❓ What is Evidently AI used for?
Evidently AI is an open-source Python library designed to monitor machine learning models and detect issues such as data drift, concept drift, and performance degradation. It provides pre-built reports, customizable dashboards, and API integrations to make monitoring seamless and efficient.
I recommend using Evidently AI if your team is looking for a free, open-source alternative to commercial ML monitoring tools like Fiddler AI or Arize AI. It works excellently with Prometheus and Grafana for end-to-end visibility in production environments.
📚 Reference: See the official Evidently AI Documentation for detailed setup guides and examples.
❓ Can Prometheus monitor machine learning models?
Yes ✅ — Prometheus can monitor ML models by scraping metrics such as latency, accuracy, and drift statistics exposed by your application.
When paired with Evidently AI for drift detection and Grafana for visualization, Prometheus becomes a core component of a free, production-grade ML monitoring stack. I recommend following the Prometheus Documentation to learn how to configure scrape jobs for ML model endpoints.
💡 Pro Tip: You can use Alertmanager with Prometheus to trigger Slack or email alerts when a model’s accuracy drops below a set threshold.
❓ How to detect data drift in real time?
To detect data drift in real time:
- Expose metrics from your model service (e.g., via FastAPI or Flask).
- Use Evidently AI to compute drift statistics on a rolling window.
- Send drift metrics to Prometheus for continuous monitoring.
- Visualize and alert using Grafana dashboards.
I recommend testing your drift detection pipeline with synthetic data drift scenarios before deploying it in production. This ensures your alerts are tuned to your real-world data behavior.
📚 Reference: The Google Cloud MLOps Guide covers best practices for integrating monitoring and alerting in ML workflows.
XII. Recommended Learning Resources 🎓
A well-designed monitoring stack is only as effective as the skills of the team managing it. Whether you’re new to model monitoring or looking to scale your existing observability practices, these learning resources will help you deepen your expertise. I recommend starting with free documentation to get hands-on quickly, then moving into structured paid courses for advanced techniques.
🎯 Machine Learning Monitoring & Observability – Udemy
For a comprehensive journey from beginner to pro, the Machine Learning Monitoring & Observability course on Udemy offers practical, project-based learning. It covers everything from setting up drift detection with Evidently AI, to integrating Prometheus for metrics and Grafana for visual dashboards.
💡 Why I rekomendasikan: Ideal for startups and solo developers who want ready-to-use templates and step-by-step deployment strategies without needing to read through hundreds of pages of docs.
🛠️ Site Reliability Engineering – Coursera
For teams aiming to adopt production-grade monitoring practices, the Site Reliability Engineering – Coursera program teaches the foundations of observability, alerting strategies, and scaling monitoring infrastructure.
💡 Why I rekomendasikan: SRE principles directly enhance ML monitoring by ensuring systems are reliable, resilient, and cost-efficient—especially important when running tools like Prometheus and Grafana at scale.
📚 Free Documentation & References
- Evidently AI Documentation: Official guides on data drift detection, model performance reports, and API integrations.
- Prometheus Documentation: Learn how to scrape metrics, configure retention, and set up Alertmanager for automated notifications.
- Grafana Documentation: Tutorials for building real-time dashboards, configuring panels, and setting up threshold-based alerts.

Pingback: The Ultimate Guide to Building a Cost-Effective Open-Source MLOps Stack in 2025 - aivantage.space